I became fascinated with the “ North Star ” concept in 2017 when I saw this talk on Growth Hacking as per Alex Schultz, VP Analytics and CMO Meta. As my knowledge graph increased on various frameworks, I came across other concepts like OKR s, Lag and Lead Measures , JBTD Framework , etc. However, at the time, I had no idea how to use the North Star metric in my work, nor did I have any tool which supported “North Star” metric management. During the pandemic, I discovered the doubleloop app. Doubleloop lets you monitor all your contributing metrics, adding to your main North Star Metric.
What is a North Star Metric?
A “ North Star ” metric is that metric which is the most important lead measure you need to track as per the GOAL of your business. Unlike OKR , it is not quarterly but takes a longer-term view of things you need to do to achieve your objectives. Typically the North Star metric stays the same for a year or three.
A team using the North Star Framework identifies a single, meaningful metric and a handful of contributing Inputs. Product teams work to influence those Inputs, which in turn drive the metric. The North Star is a leading indicator of sustainable growth and acts as a connective tissue between the product and the broader business. (amplitude.com)
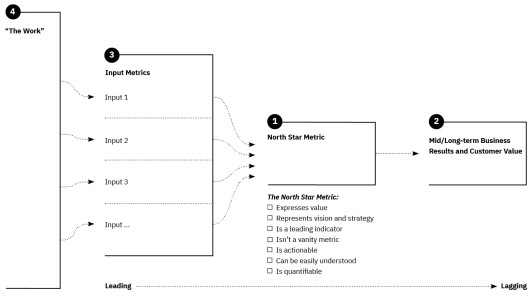
image credit - Amplitude
How is North Star different from OKRs?
As I said earlier, the North Star metric is not based on quarterly results. Quarterly results tracked on OKRs are possible when you know what you are chasing, and processes have been well established. For example, let us aim for 20% growth for this quarter is an OKR, but a North Star metric makes more sense when you are a new business and have no idea what you should target.
There is a big difference between persistent models and work (or goal) related models. OKRs, for example, are a work-related model. Work-related models involve a specific time span (e.g. a quarter). The team attempts to achieve The Goal by end-of-quarter. Meanwhile, a north star metric and related inputs persist for as long as the strategy holds (often 1-3 years ). The constellation of metrics serves as a belief map, driver diagram, or causal relationship diagram. It explains our mental model for how value is created and/or preserved in our product/system. (Schmidt, 2022)
Read more on JBTD Framework
Relation between JBTD and North Star
JBTD can be social and emotional. For, e.g. Your product meets an emotional or social need of your TAM (Total Addressable Market). When translated to a metric, this social and emotional need becomes the “North star” of your company. So all processes need to be aligned to meet this objective.
Amplitude insists that North Star is not a JBTD.
North Star is not JBTD as Jobs is a broad description independent of whether your existing product line can achieve or not. This is where innovation happens when you are not constrained to think on how to make your product better. (amplitude.com)
Read more about the JBTD Framework.
Resource
The best resource to learn about North Star is this Amplitude playbook on the same.